Datacenter Tracker
A database of US data center construction projects, with a source for every figure.
Live figures:1,381 projects · 46 states · 14,955 citations· updated today
A command-line tool that collects US data center construction projects from news articles, SEC filings and grid-connection queue exports, in a loop that runs by itself every night. Each stored value records which source supports it and how strongly. The same SQLite data can be read from the CLI, a full-screen terminal interface or a web console.
- Status
- Running by itself every night and in daily use. Discovery finds new articles more easily than older projects, so coverage of older projects is still being filled in.
- , from its code on GitHub
Overview§
To follow the US data center buildout you have to read press releases, local news and filings. They repeat each other, round their figures and disagree. One campus can appear under four company names. One megawatt figure can mean the computing load, the whole site's draw or a generator's nameplate. The tracker records what is being built and which source says so.
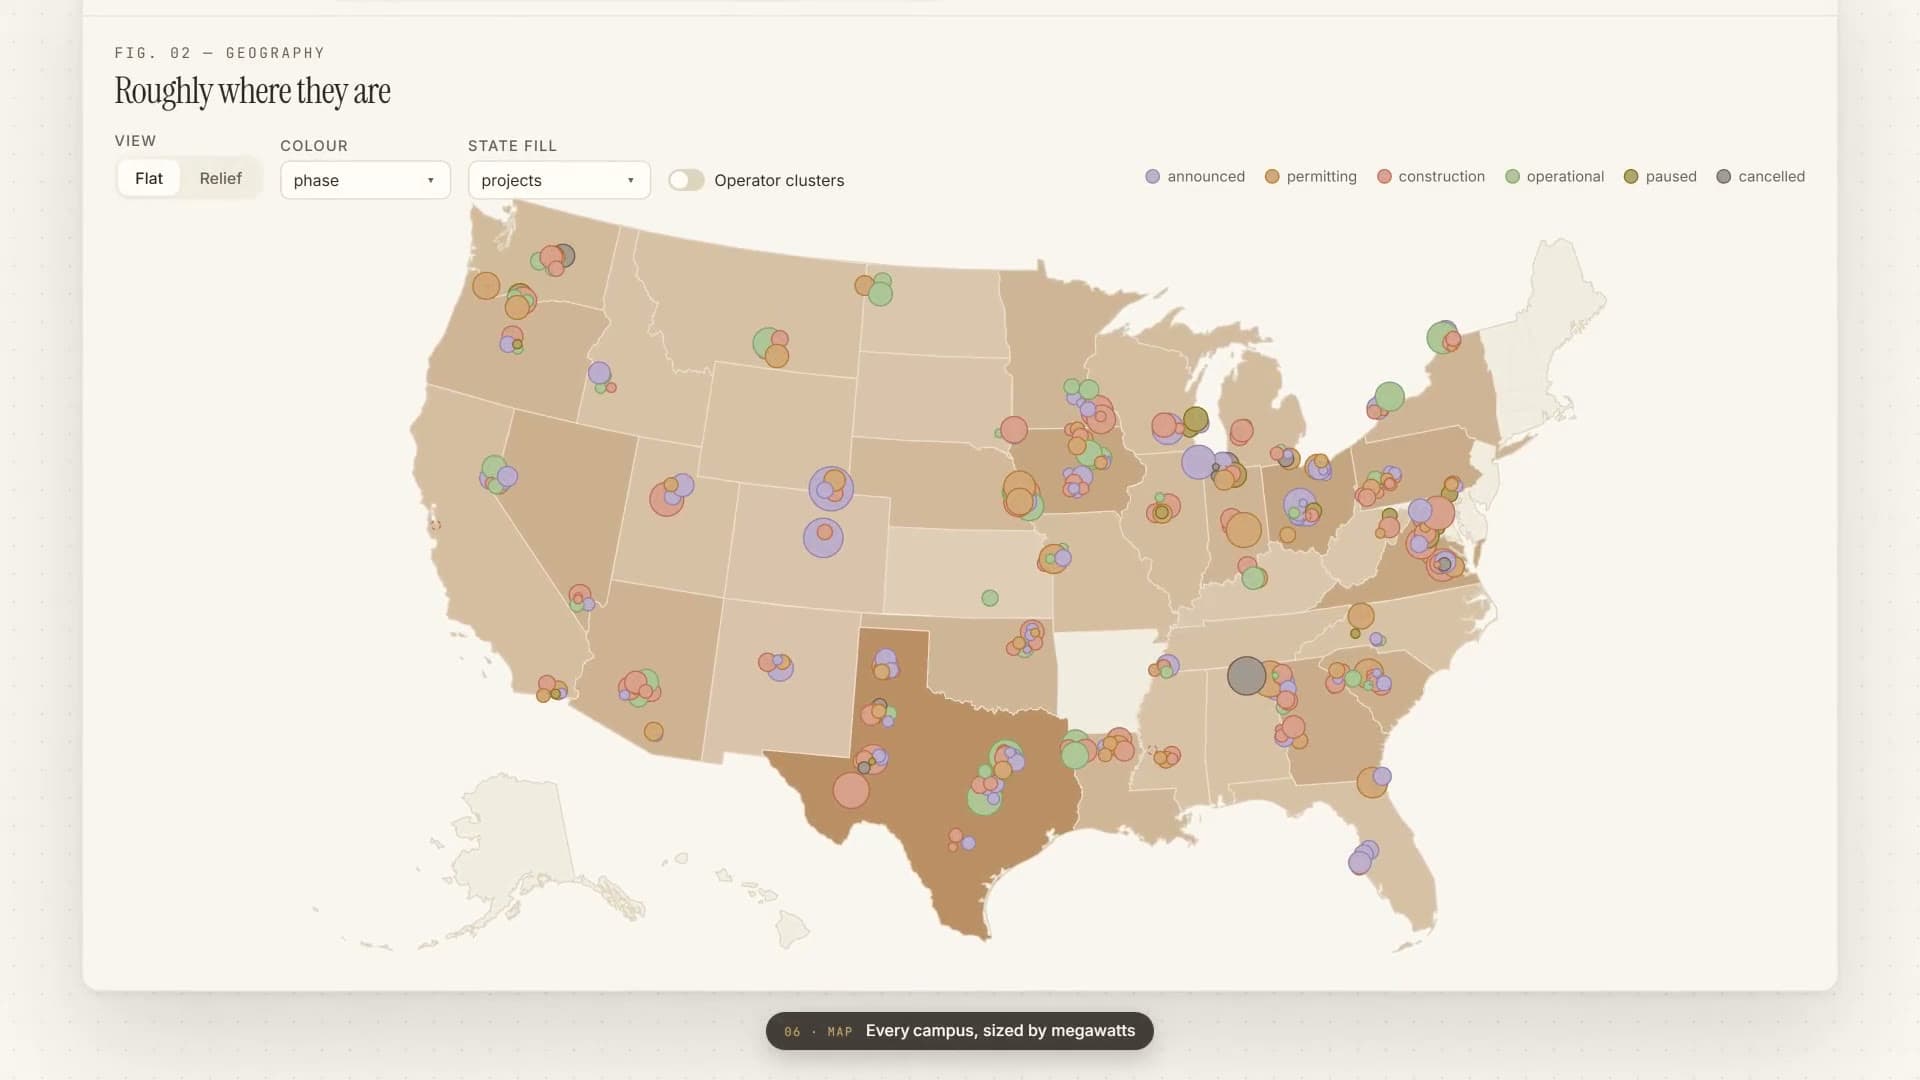
Every night a loop searches the news, reads new articles and filings, and re-reads the stored values most likely to be wrong. It stops at set limits on money, tokens and searches, and `tracker loop` draws its progress as bars. Each step reports what it read, which values it kept (with the sentence that states each one) and which it refused. You can browse the results in the terminal interface or the web console: a sortable list of campuses, a map, who is paying, and a page for each project. Any cited article opens in a reader built from a saved copy of the page, with the quoted sentences highlighted. An Updates page shows what was reported in the last two months on the projects you watch. A Rules view lists policies that reach many projects at once, such as a state pause or a town ban, and readers are emailed when one reaches a project they watch.
It is in daily use. A quote shows that a sentence exists, not that the value is true: on 30 October, checked answers for the 50 biggest campuses disagreed with 83 of 259 stored values, each of which had a real sentence behind it. So the tracker now scores itself against that answer key, and a change to how values are chosen is measured against it before it ships. Merging duplicate campuses and excluding sites that aren't data centers are the only steps that delete rows, and both take a snapshot first.
At a glance§
- Role
- Built alone, with AI coding assistants
- When
- 30 Jul 2026 to 11 Nov 2026 · 3 months
- work on 90 different days
- Commits
- 750
- saved steps of work
- Automated tests
- 3,913
- checks the code runs on itself
- Code
- 162,416 lines of Python
- 180,061 in all
- Version
- 7.0.9
Counted from the repository on 11 November 2026: commits on every branch, without merges; tests as written, so one that runs several cases counts once; lines that are not blank, without other people's code, generated files or lockfiles.
Key facts§
- 4,730 tests. They pass on a fresh checkout with no API key and no network.
- Repairing lightly edited quotes raised quote acceptance from 75% to 95%, with no false positives against unrelated articles.
How it works§
The evidence check runs in code, not in the prompt. The model has to quote the article for each value it extracts, and the value is dropped unless that quote actually appears on the source page.
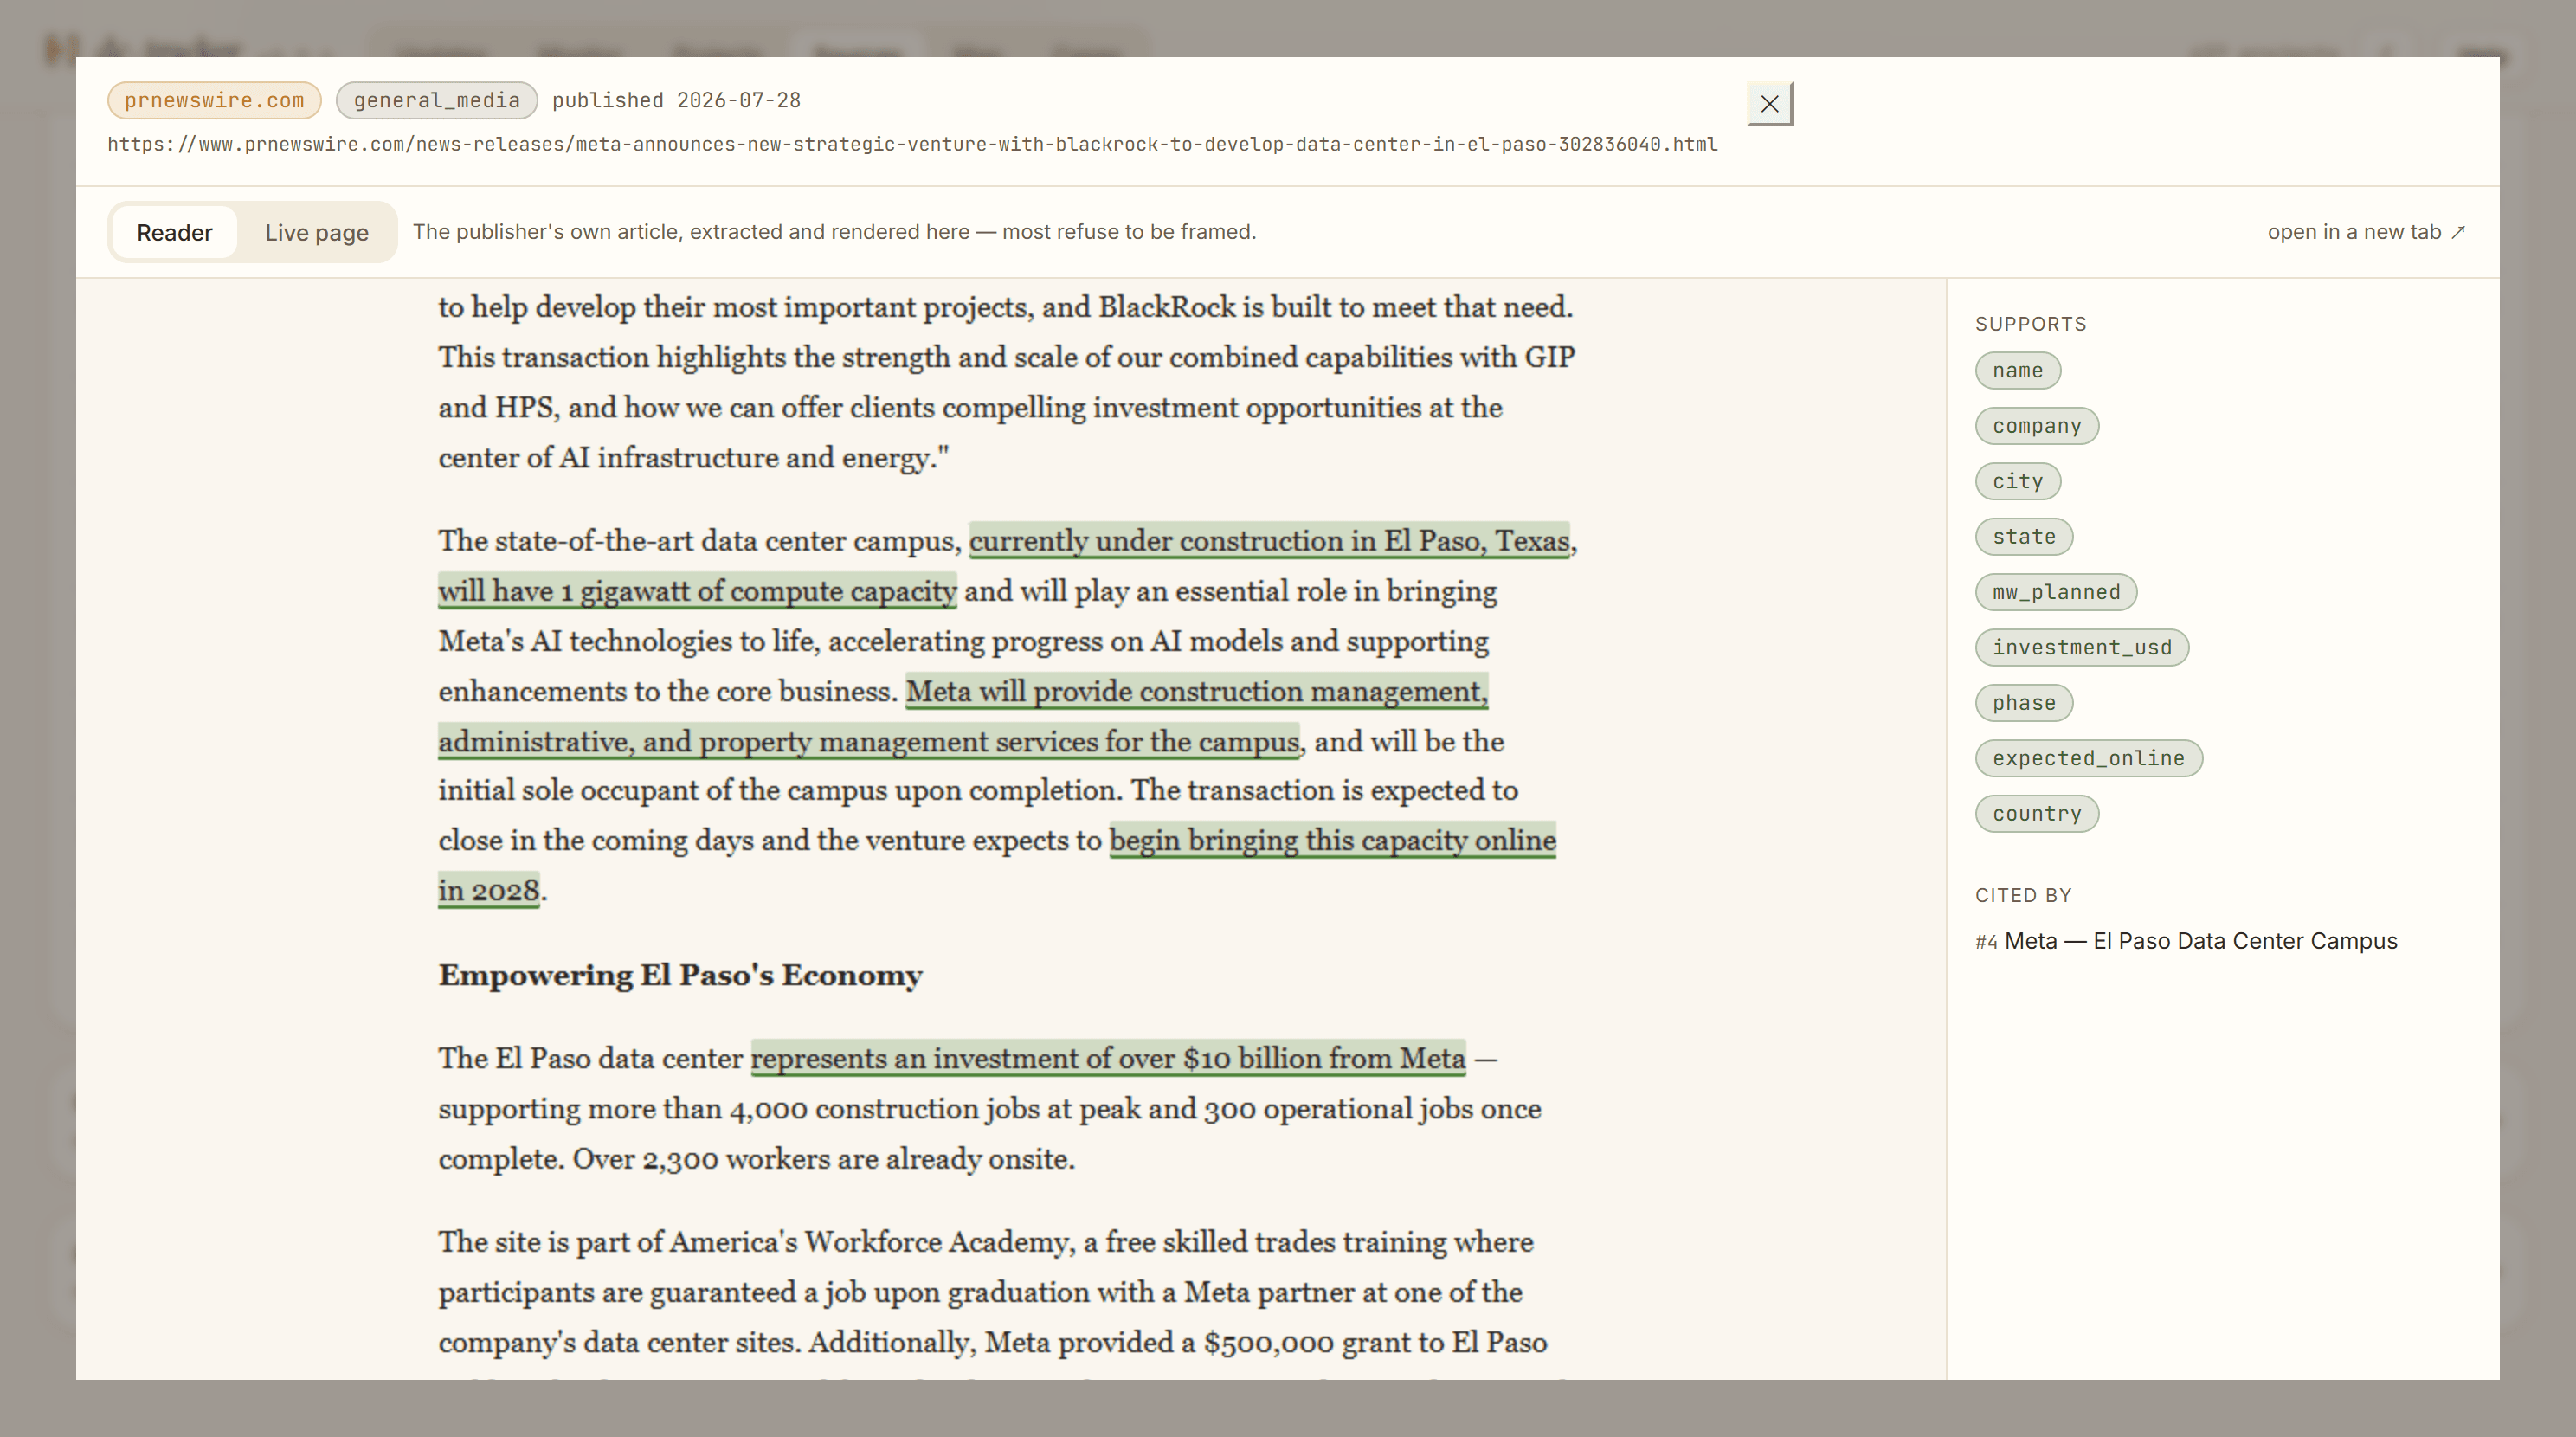
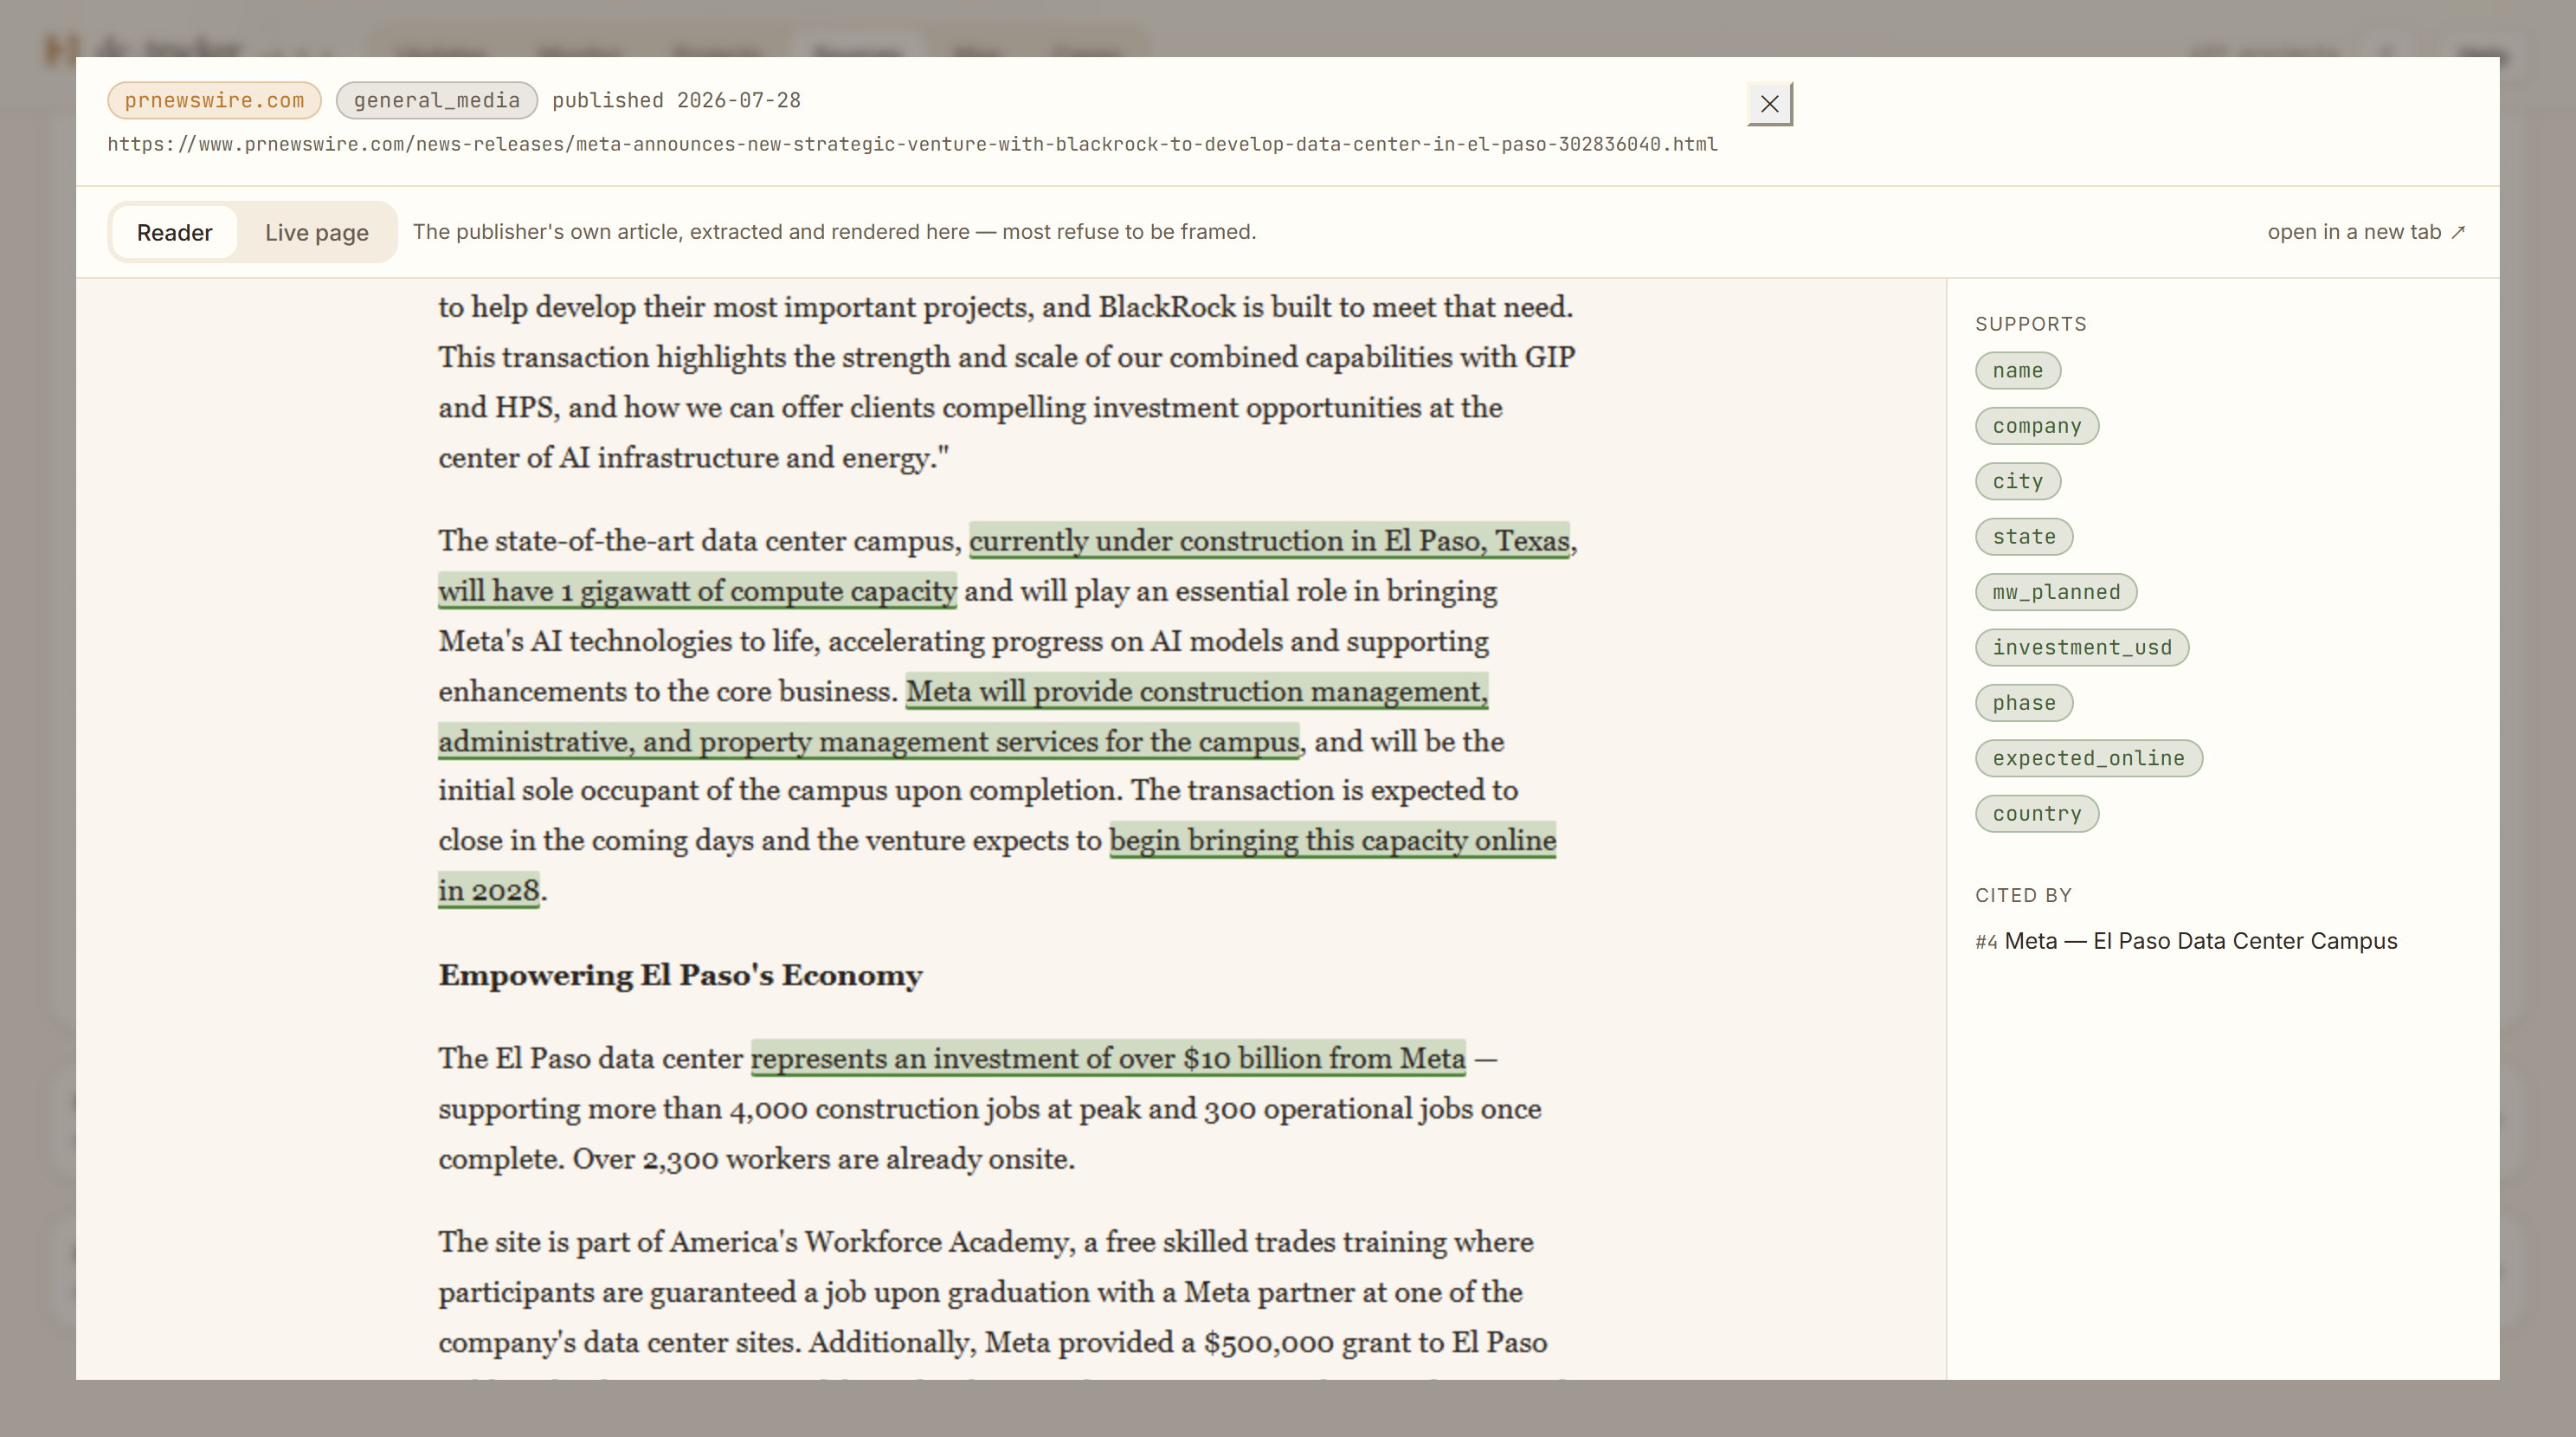
The source reader shows the article as published, with each sentence behind a stored value highlighted. Each value is labelled by what it rests on. The labels are reported, derived, unconfirmed, inferred and defaulted. Values that can't be confirmed are kept and flagged, not deleted.
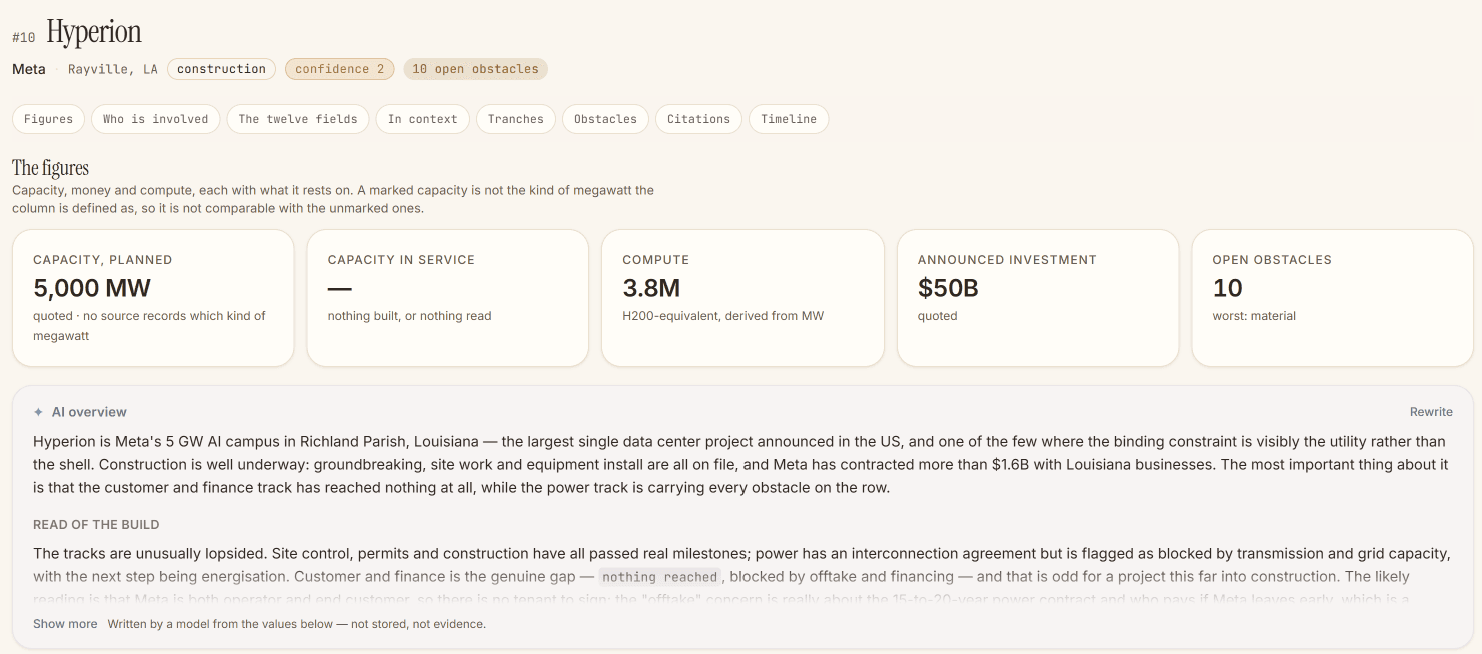
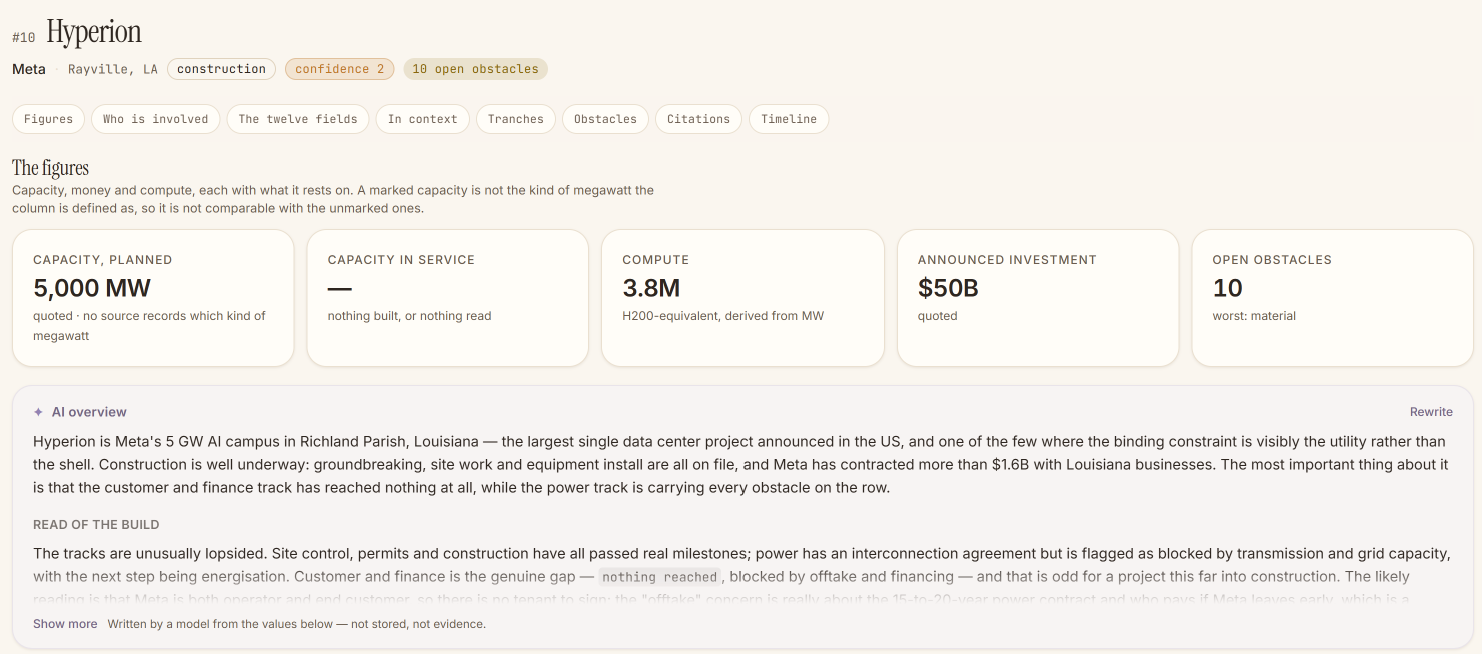
One project. Each figure shows whether it is quoted, derived or missing. Confidence (0–3) is recomputed each time, never stored. Sources only count as independent if they are on different website domains, so a single source can never reach 3.
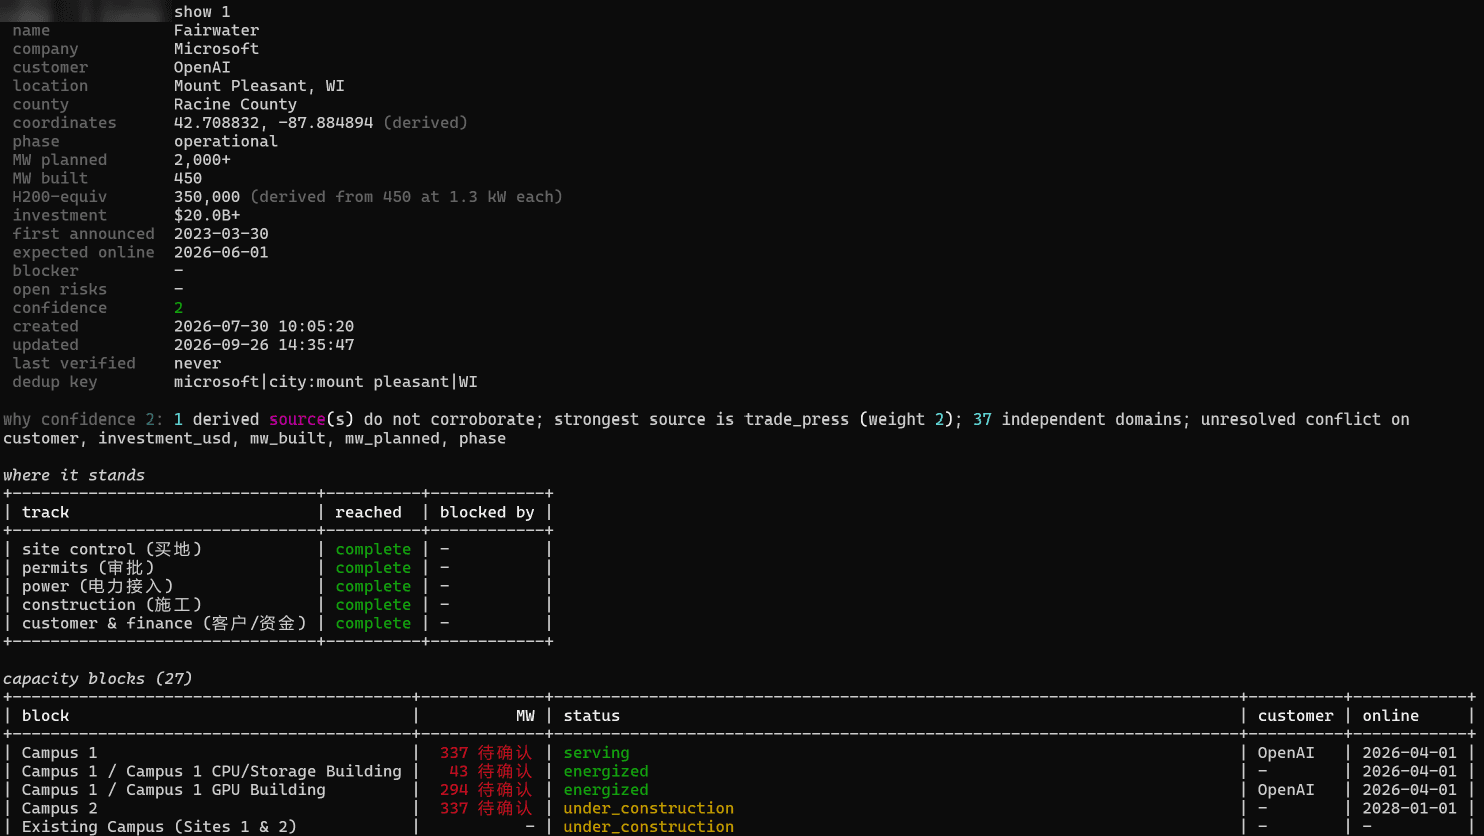
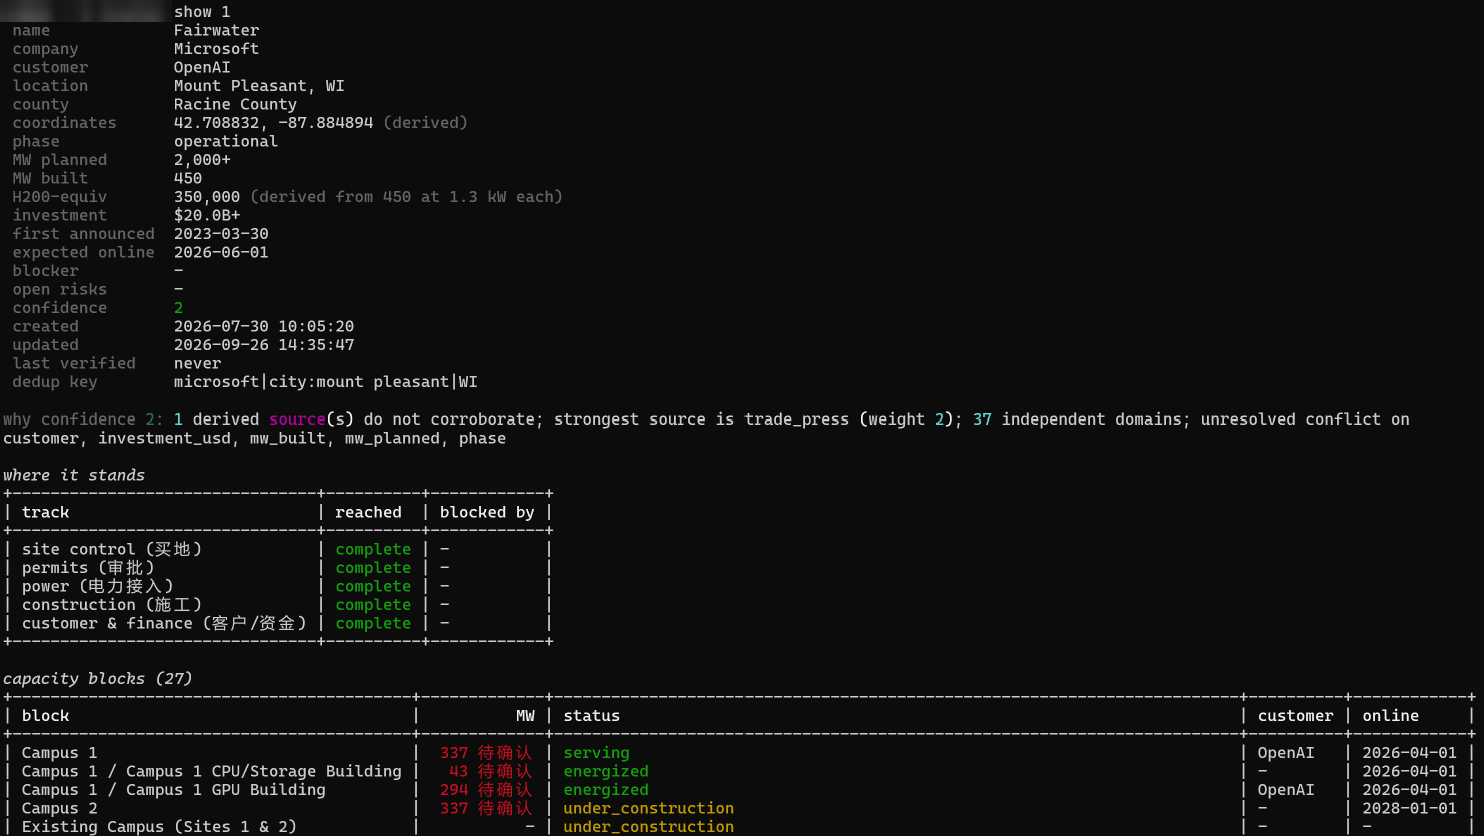
tracker show prints the row, why its confidence is what it is, and where each track stands. Progress is split into five separate tracks. They are site control, permits, power, construction and commercial. Grid power is never inferred from the other four, because a finished building still waiting for power is the most useful signal in the data.
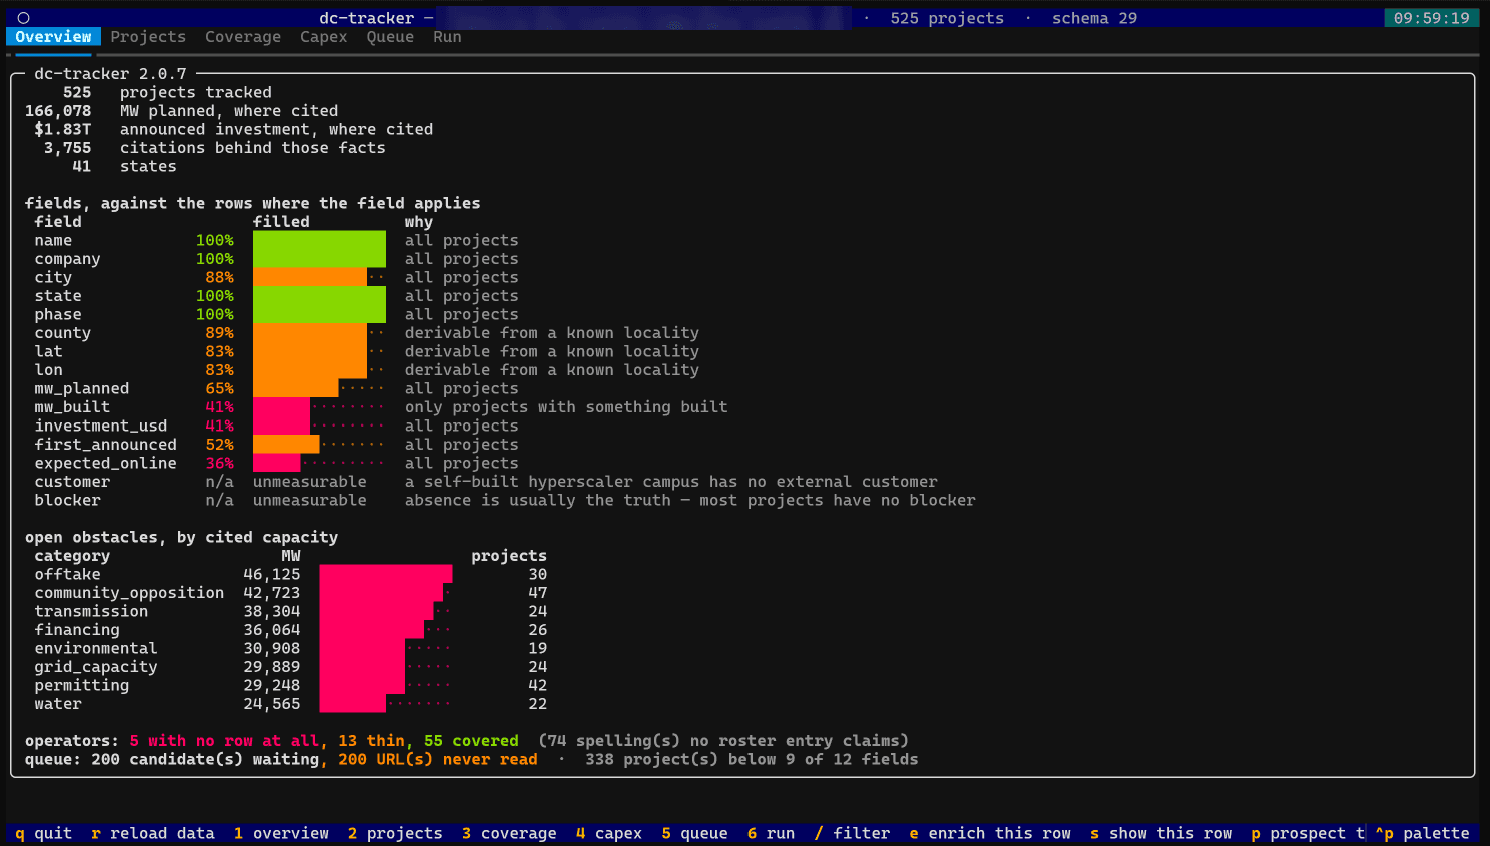
tracker tui shows how complete each field is and what is holding capacity back. Only the CLI writes project data. The web console reads it without changing it, and all judgements are computed on the server, so the browser and the CLI always agree.
Every other night a model plans the work, but only from a fixed menu of steps. Code decides what is allowed, runs each step as an ordinary command, and stops the night at its money ceiling: a share of the month's budget, never more than ¥45.
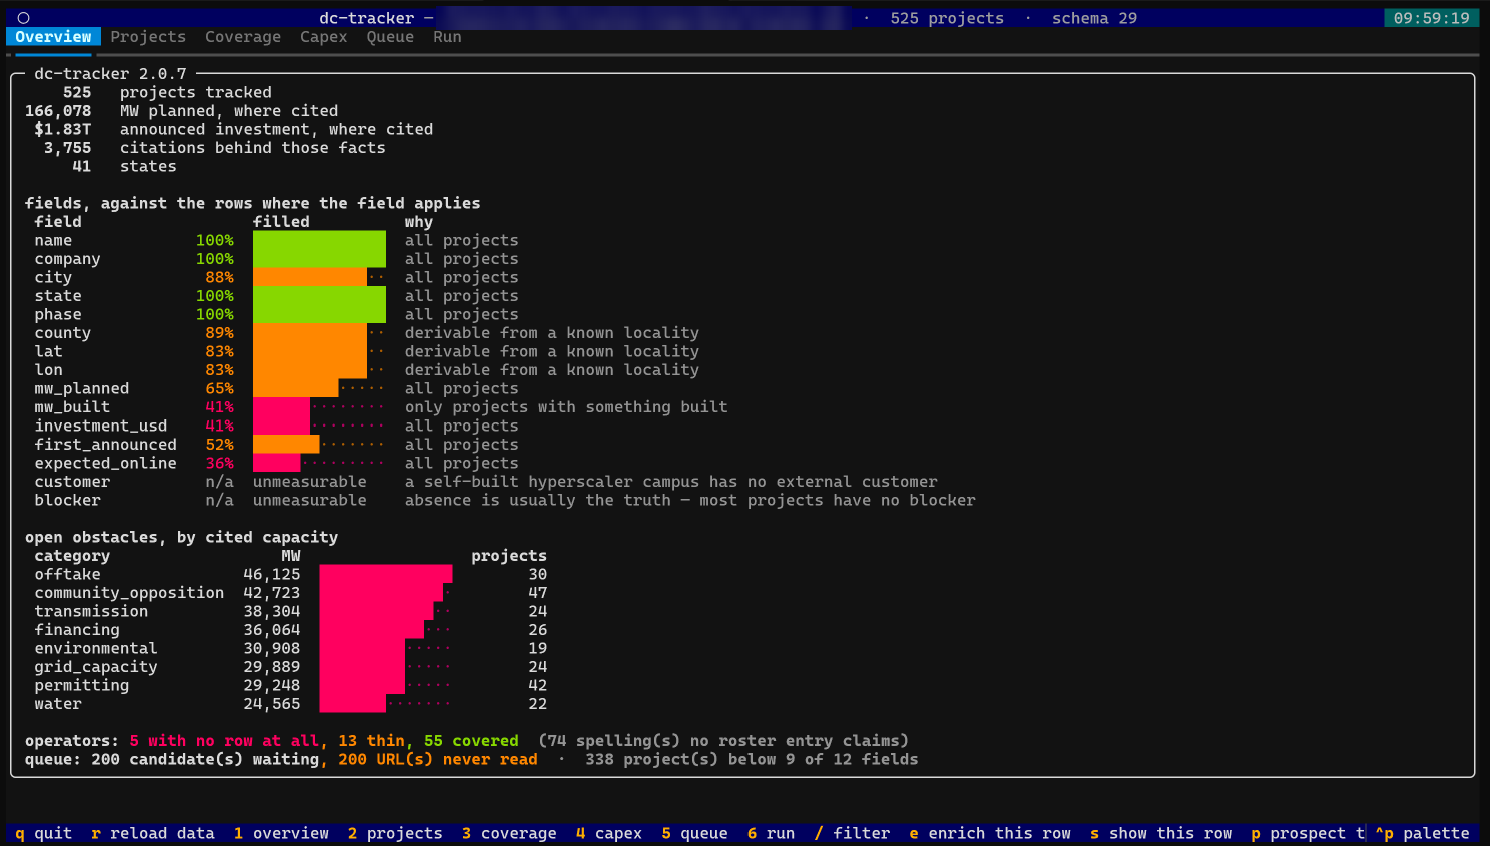
Screens§
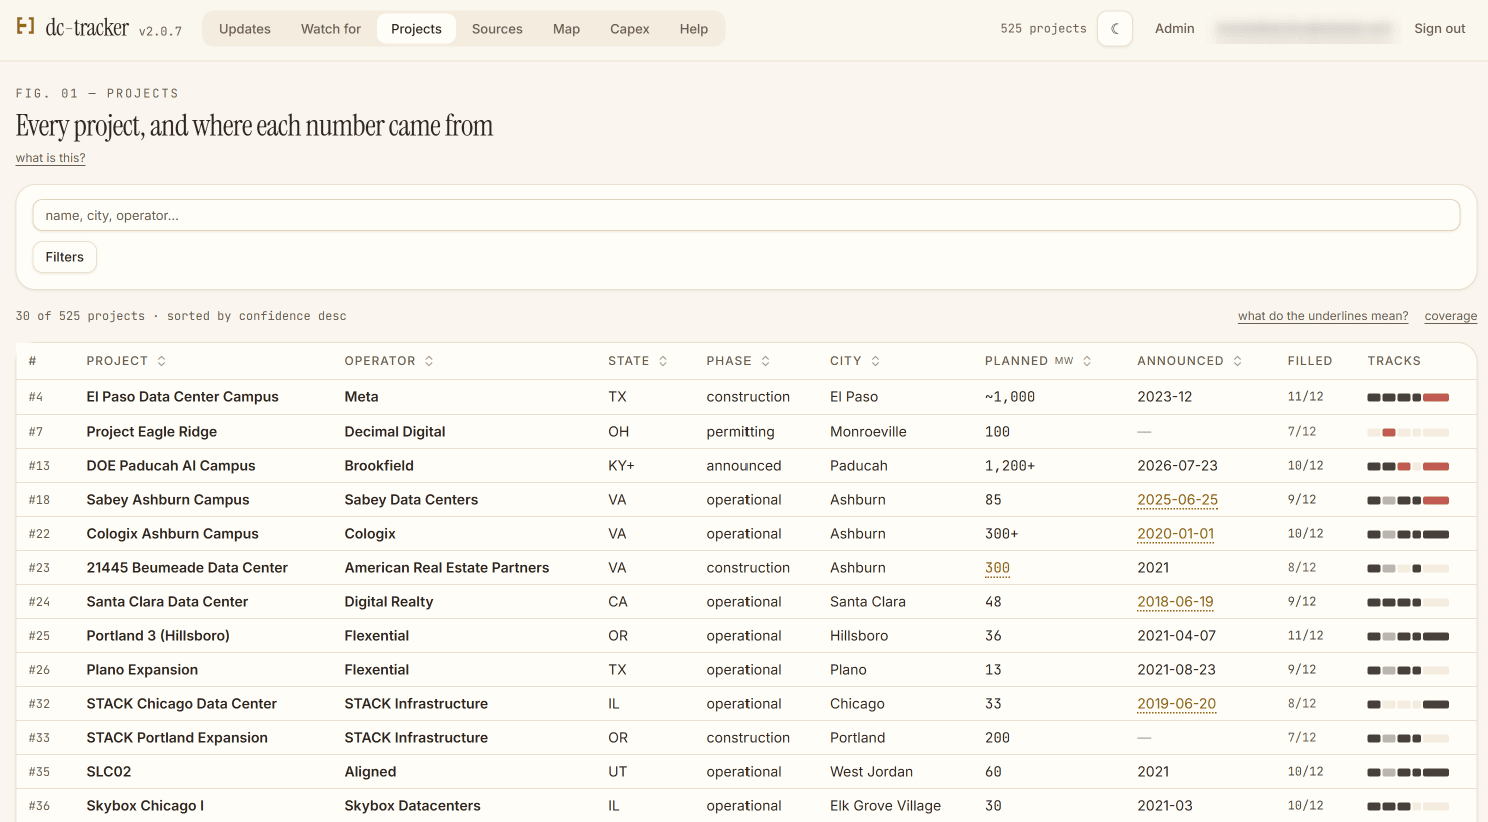
The console lists every project, sortable, with how complete each one is and how far each track has got.
Built with§
- Python, also used in Squash Review, mcAI, lidfold, and Learning RL by Playing Games
- SQLite (WAL), also used in Aethalides, Jarvis for Projects, agento, and Ocr-kb-matcher (KIP)
- Textual
- DeepSeek / Ollama, also used in Sisyphus and Aethalides
- Serper, also used in Odysseus
- Playwright
- SEC EDGAR
- US Census
- pytest, also used in mcAI